Rain at ZCU - graphs
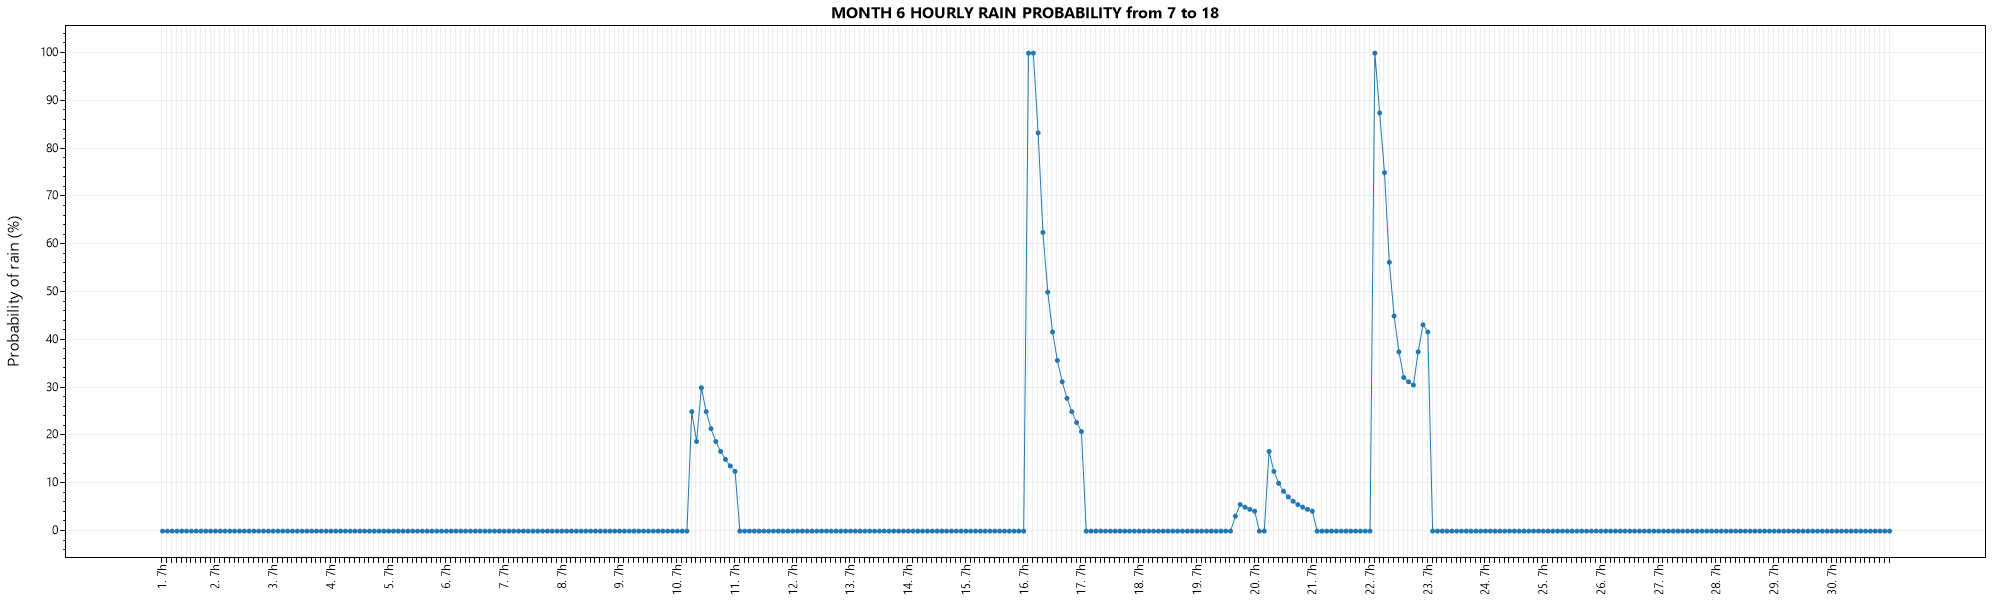
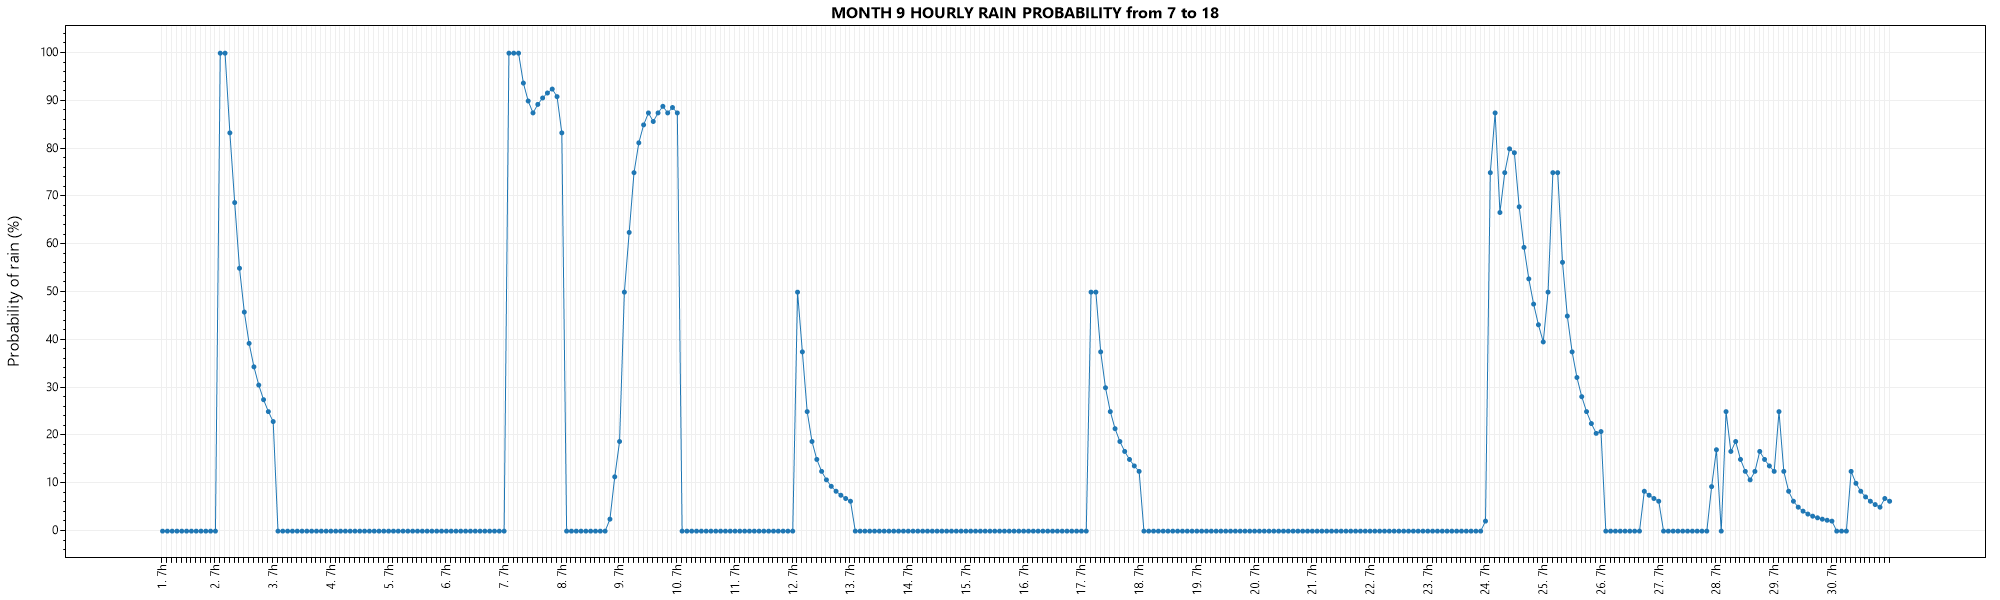
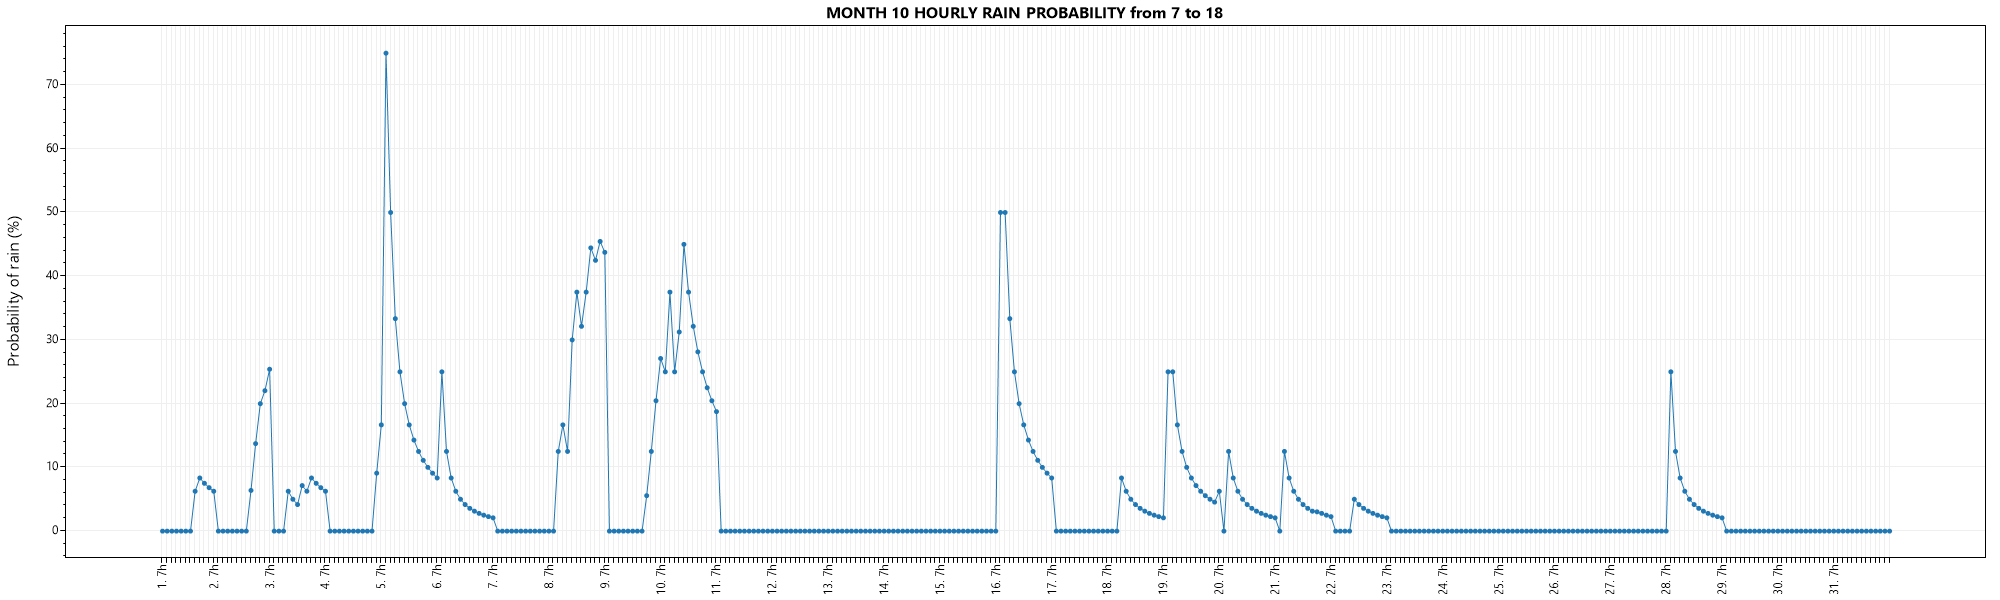
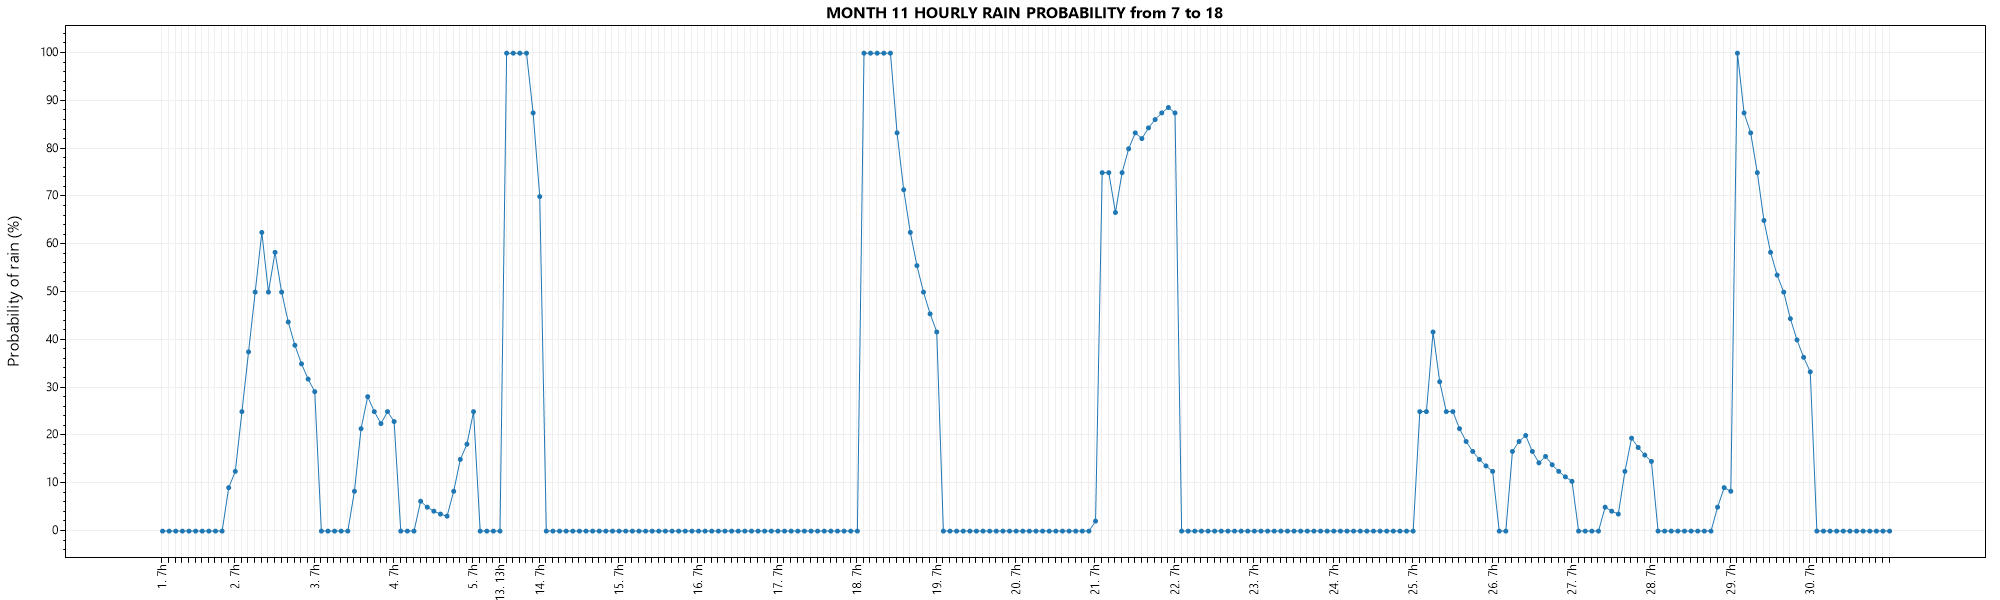
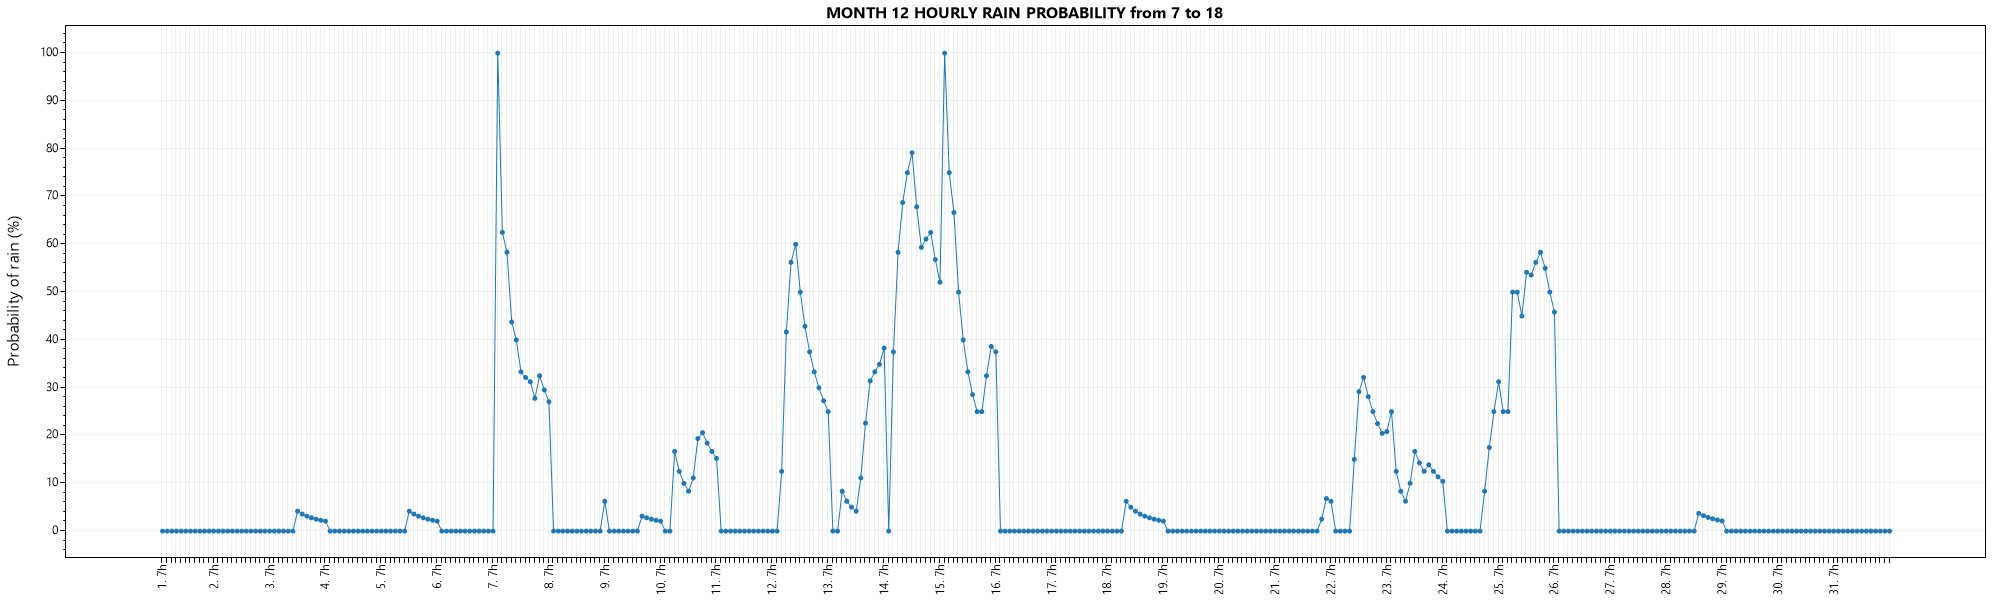
Below are listed graphs depicting the probability of rain. Visualized values are between 0% and 100% and were computed using the following process:
In the data source are rain values given by 0 (no rain) and 1 (rain). Those values are measured roughly 4 times per hour. From this data could be computed the probability of rain within this one hour by taking the number of times that were measured as 1 and the number of measured data in the hour. In the same way the probability of rain in the day up until now can be computed, taking number of detected rain (value 1 in data) and number of measured data since morning.
This process was chosen because it simulates the thought process of a student, that will decide based upon if it had rained up until now, and asses the probability that it will be still raining. Aka if it was raining the whole morning, one would assume it will still be raining at noon.
Data is measured 24/7, however we decided to take into account only data from 7am to 6pm as those are the relevant hours classes take place in. Classes later in the evening would be with high probability influenced way more by the time of day they take place in than the current weather.
June 2019
September 2019
October 2019
November 2019
December 2019
Aktualizováno uživatelem Alex Konig před téměř 4 roky(ů) · 3 revizí