Akce
Luminance at ZCU - graphs
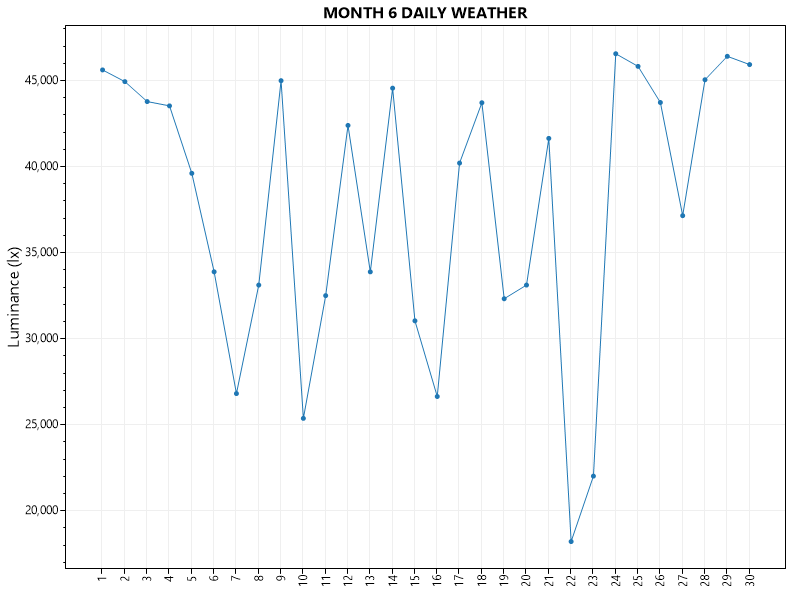
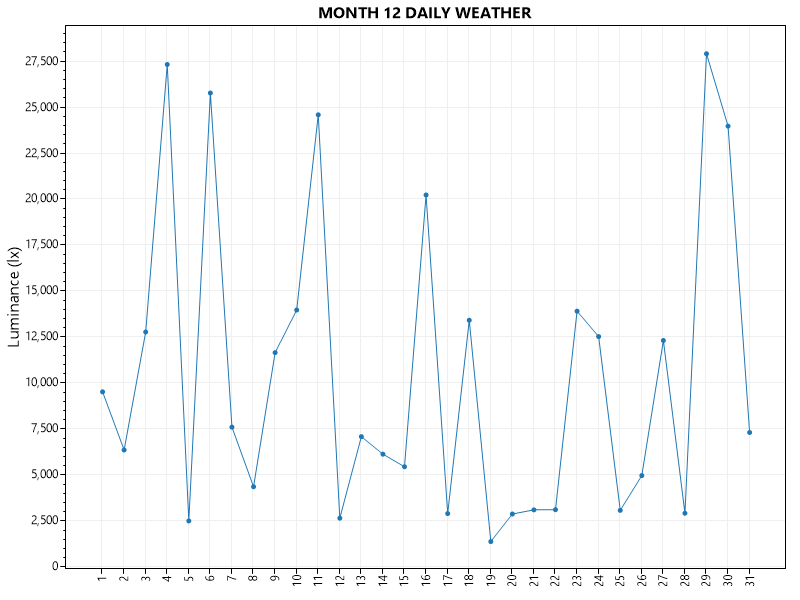
On the graphs below are displayed the values of luminance measured at zcu. Data is measured 24/7 roughly 4 times per hour, in those graphs are daily averages from values from 7am to 6pm.
There is a question if averages per hour wouldn't be more suitable for our application. However sun has different "strength" during different parts of day even if the weather conditions are otherwise still the same.
June 2019
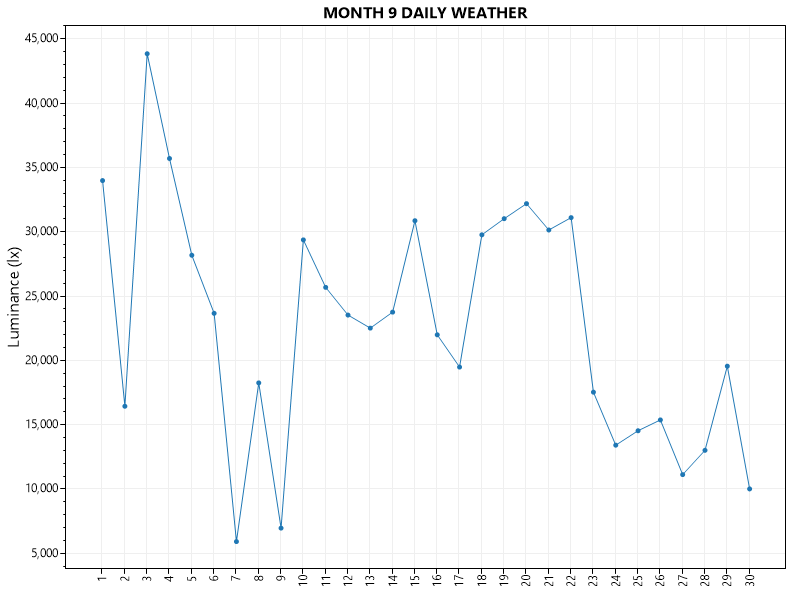
September 2019
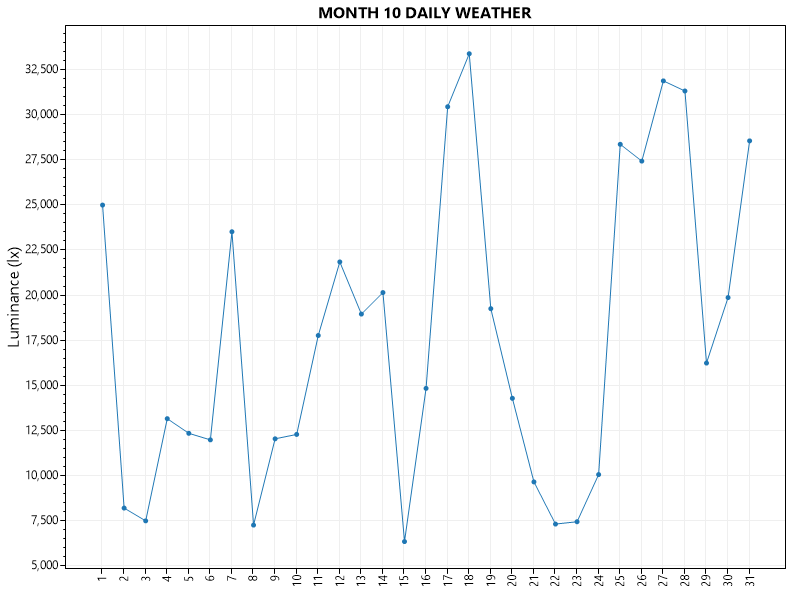
October 2019
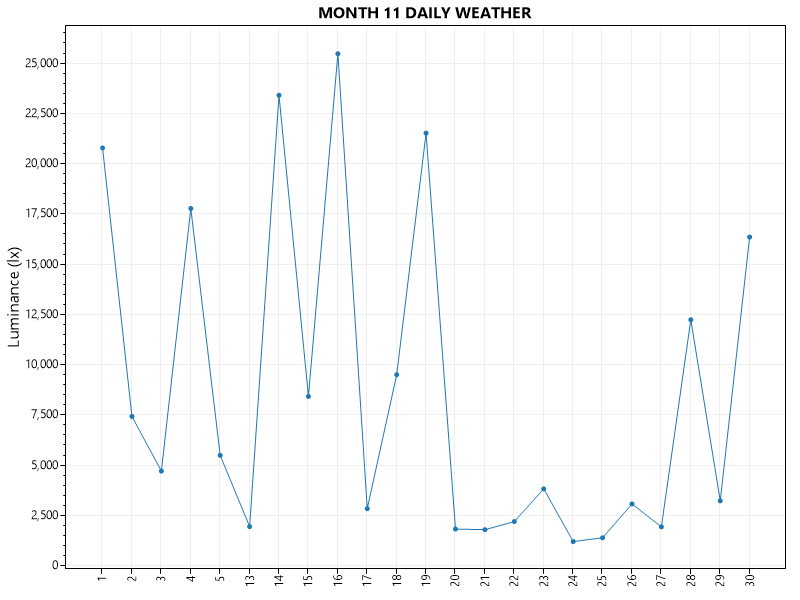
November 2019
December 2019
Aktualizováno uživatelem Alex Konig před téměř 4 roky(ů) · 3 revizí